Centre d'apprentissage
Débuter avec COMSOL Multiphysics®
études / Post-traitement des résultats du balayage
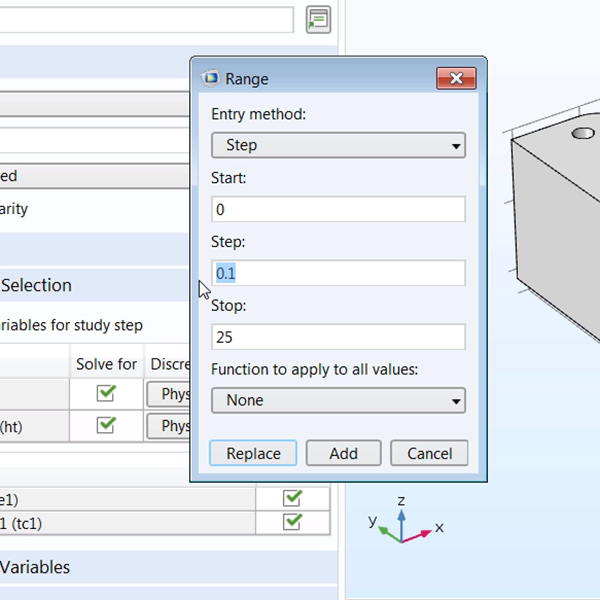
Visualize the results from a parametric sweep. Duration: 3:53After running a COMSOL Multiphysics® simulation that yields multiple results, there are specific ways to postprocess the data. Using a simple parametric sweep study, we show you how to tabulate your data and display it in an informative way. Features include the Table Surface plot type, tables, and the ability to export the data to other programs.
This video uses a parametric sweep (created in a previous video, Performing a Parametric Sweep Study in COMSOL Multiphysics®) to detail the ways in which tables can be used in simulations that give multiple results. Applicable simulations include those with auxiliary and parametric sweeps, function and material sweeps, and time-dependent and frequency-domain studies.
Fichiers de l'exercice
postprocess_sweep_complete.mph
Téléchargement
postprocess_sweep_start.mph
Téléchargement
-
Introduction
-
Interface Utilisateur
-
Géometrie
-
Définitions
-
Matériaux
-
Physiques
-
Maillage
-
études
-
Résultats
-
Constructeur d'applications