

When inside a room — a conference room, concert hall, or even a car — everyone has an opinion of when the “acoustics” are good or bad. In room acoustics, we want to study this notion of sound quality in a quantitative way. In short, room acoustics is concerned with assessing the acoustics of enclosed spaces. The Acoustics Module of COMSOL Multiphysics has several tools to simulate the acoustics of rooms and other confined spaces. I will present those here.
Introduction to Room Acoustics
When sound is emitted inside a room, a listener will perceive the sound as a combination of direct sound from the source as well as sound reflected off the walls. At the walls, the sound is reflected, absorbed, and scattered.
Since all of these processes are frequency dependent, a poorly designed meeting room can, for example, be highly reverberant in a frequency band that is important for speech. The room could also have a strong modal behavior (standing waves) at certain critical frequencies that are easily excited. These are things you want to avoid and be able to predict when designing a room.
Designing for Sound
Architects and civil engineers want to control the sound field by placing absorbers, diffusers, and reflectors in appropriate locations. In concert halls, you want to maximize the listening experience where the audience is located. In office spaces, you want to avoid anything that can seem noisy and disturb the concentration of employees. In classrooms and lecture halls, you want to ensure clear perception of speech. The sound environment is important for various reasons, which is why there are national standards and regulations for the sound environment in many cases.
Refurbishing a badly designed room can be very expensive, so you do not want to rely only on measurements on scale models or measurements done after the fact. Modeling the room acoustic behavior beforehand is important and essential in order to optimize and perfect the design. Simulation models and measurements need to relate architectural aspects (geometry) to subjective observations using physical measures (metrics). This is done by calculating a long range of room acoustic measures, such as the reverberation time, early decay time, clarity, and many other standardized parameters.
The modeling approach you want to adopt depends on the studied frequency (the wavelength compared to geometrical features of the room). In the Acoustics Module of the COMSOL suite of FEA software, we essentially offer three approaches packaged in three physics interfaces. The Pressure Acoustics interface can model the modal behavior in rooms. The Ray Acoustics interface and the Acoustic Diffusion Equation interface cover the high frequency limit or reverberant behavior (geometrical acoustics). I discuss the interfaces and their applicability in the sections below.
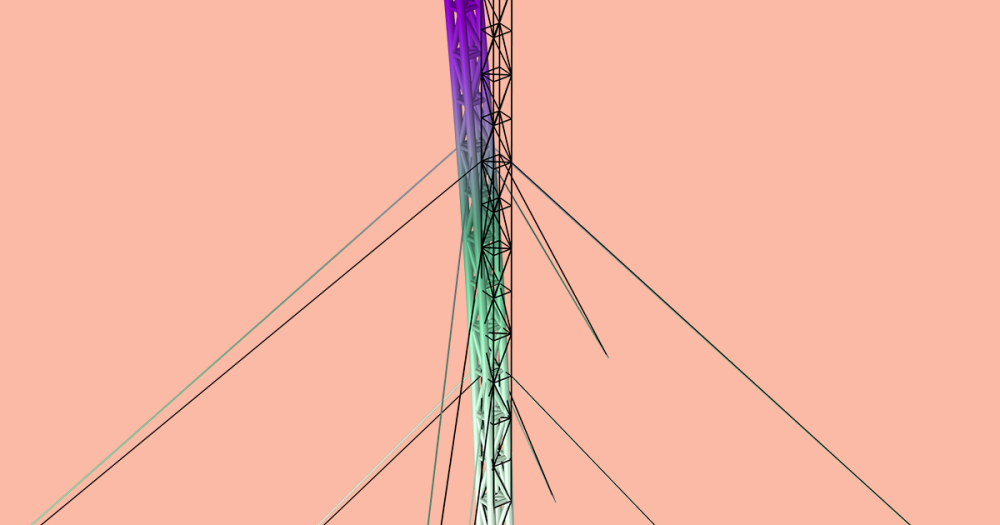
Animation of the ray front position as they are released inside a small concert hall. The color scale gives an impression of the ray intensity on a logarithmic scale.
Physical Room Acoustics
As mentioned above, room acoustics is typically divided into three categories, depending on the studied frequency. Or, more specifically, depending on the wavelength compared to the characteristic geometric features of the room in question.
In the low-frequency range, the room resonances dominate. This is known as the modal region. At the other end of the scale, in the high-frequency limit, the wavelength becomes smaller than the characteristic geometrical features of the room. Here, we deal with the reverberant region or the geometrical acoustics limit. Between the modal and the high-frequency limit, there is a so-called transition zone. Note that there is no clear-cut definition of this zone.
Classical room acoustics theory provides some tools that enable a back-of-the-envelope assessment of the behavior of a room. For a given room, the Schroeder frequency, f_\textrm{s}, predicts the limiting frequency between the modal behavior and the high-frequency reverberant behavior of the room.
The Schroeder frequency is given by:
(1)
where V is the room volume and T_{60} is the reverberation time.
The equation is based on the criterion (suggested by Schroeder) that at the limit, three eigenfrequencies fall into one resonance half-width. The reverberation time (or decay time), T_{60}, is the time required for the sound pressure level (created by an impulse source) to decay 60 dB. A first simple approximate measure of the reverberation time is given by the well-established Sabine formula:
(2)
Here, c is the speed of sound and A is the total absorption, where S_i and \alpha_i are the surface area and absorption of the ith surface, respectively.
This is possibly the best-known formula in room acoustics. The equation stems from a classical statistical room acoustics analysis assuming a pure diffuse sound field. In a diffuse sound field, the sound pressure level is uniform and the reflected sound dominates. This phenomenon is also known as a reverberant sound field. In such a field, the damping constant (related to the overall absorption) can be approximated and relates to the reverberation time.
The modal behavior of rooms and enclosed spaces is best analyzed solving Helmholtz equation or the scalar wave equation using the finite element method. In the reverberant or high-frequency limit at frequencies above the Schroeder frequency, you may utilize two different approaches. Your choice depends on the assumptions that can be made and the desired level of detail.
The Acoustic Diffusion Equation interface may be used in the purely diffuse sound field limit, neglecting all direct sound. This is a fast method to assess reverberation times and sound pressure level distributions in systems of coupled rooms. The ray tracing capabilities of the Ray Acoustics interface provide a much more detailed picture including the direct sound and early reflections. With this interface, you also have the ability to reconstruct an impulse response.
Modal Behavior with Pressure Acoustics
Up to the Schroeder frequency, the modal behavior of rooms is important, where standing waves dominate over the reverberant nature. Inside a car, the transition may be as high as somewhere between several hundreds of Hertz up to 1000 Hz. In a small office, it may be up to 200 Hz, while in large concert halls, the transition is typically below 50 Hz. In the small concert hall model shown below, the Schroeder frequency is 115 Hz (the reverberation time is about 1.3 s and the volume is 430 m3). The modal behavior is important for subwoofer systems in cinemas, for instance.
The modal behavior as well as the room eigenfrequencies are best analyzed using the Pressure Acoustics interface. A frequency domain study can reproduce a transfer function for the bass system. You can also use it to analyze dead regions or find eigenfrequencies. A transient study is interesting when, for example, looking at bass build-up transients inside a car cabin.
Models of interest here are:

Pressure distribution for the first eigenmode inside a small room. From the Eigenmodes of a Room model.
High-Frequency Behavior with Ray Acoustics
If you want to compute the trajectories, phase, and intensity of acoustic rays, you should choose the Ray Acoustics interface. Ray acoustics is a good choice when working in the high-frequency limit where you have an acoustic wavelength that is smaller than the characteristic geometric features. The interface is not limited to modeling acoustics in closed spaces, like rooms and concert halls, but can also be used in outdoor environments. At exterior boundaries, you can assign various wall conditions, such as combinations of specular and diffuse reflections. The frequency, intensity, and direction of the incident rays may influence both impedance and absorption.
Below are two figures from the Small Concert Hall model found in the Model Gallery for the Acoustics Module.
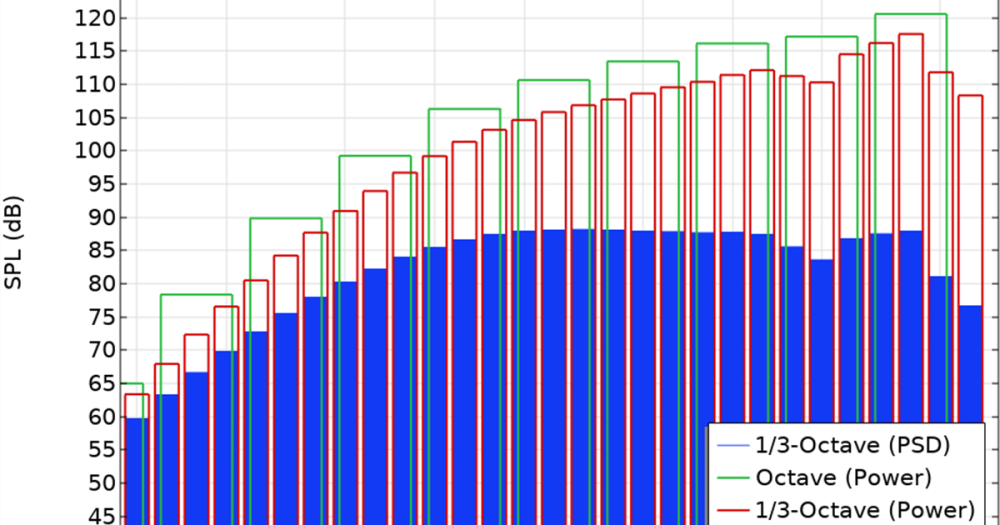
The figure to the left depicts the ray paths for a selected number of rays emitted from a source located on the small stage. The figure to the right depicts the energy response as measured in the center of the room. The dots represent the simulated ray response (5,000 rays are released) and the green and red curves represent decay curves based on simple Sabine-like estimates of the reverberation time T_{60}. The cyan curve is a so-called Schroeder integration of the energy response, yielding the energy-decay curve. All four agree well when the response is measured in the center of the room.
")
")
Left: Ray path for a selected number of rays emitted from a source located on a small stage. Right: The energy impulse response compared with two simple decay measures and the energy decay curve.
With the Ray Acoustics interface, the response can be measured at any point in the concert hall. The properties of absorbers and diffusers can be both frequency-dependent and angle-of-incidence dependent. Thus, the listening environment can be well described, analyzed, and optimized. The simple estimates are not accurate everywhere in a room and not for complex room geometries.
High-Frequency Behavior with the Acoustic Diffusion Equation
The Acoustic Diffusion Equation interface solves a diffusion equation for the acoustic energy density distribution for room acoustics. The method is also sometimes referred to as energy finite elements. This method is an extension of the principles used to calculate the Sabine reverberation time in Equation 2. This particular interface is applicable for high-frequency acoustics when the acoustic fields are diffuse. The diffusion of the acoustic energy density depends on the mean free acoustic path and thus on the room geometry. Absorption may be applied at walls and a transmission loss may be applied when coupling rooms. Increased diffusion due to room fitting can be added. Material properties and sources may be specified in frequency bands.
Compared to a ray acoustics simulation, this interface does not include any phase information, direct sound, or early reflections. The interface supports stationary studies for modeling a steady-state sound energy or sound pressure level distribution. You can use a time-dependent study to determine energy decay curves and reverberation times. You can use an eigenvalue study to determine the reverberation time of coupled and uncoupled rooms. The eigenvalue is directly related to the exponential decay time and so the reverberation time.
We utilized all three study types in the One-Family House Acoustics model, which studies the acoustics in a single-family home with a noise source located in the living room.
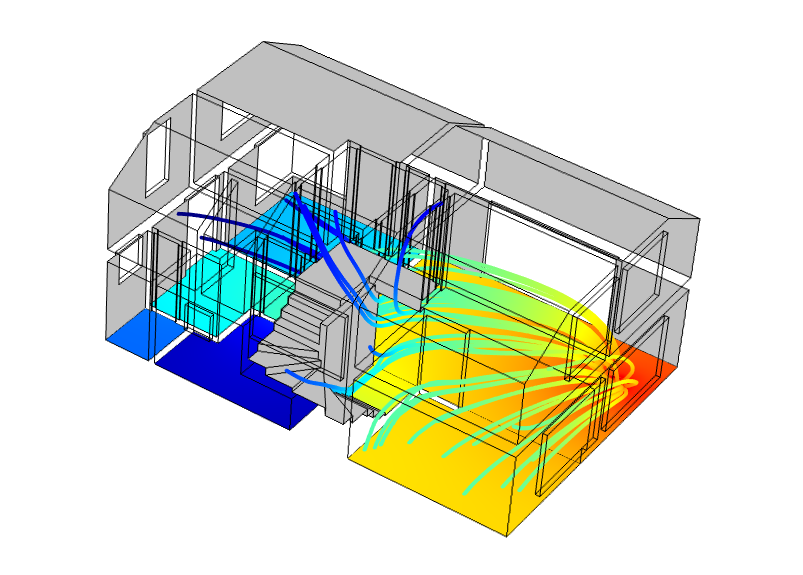
Energy flux and SPL distribution inside a two-story single-family house.
Further Reading
Check back on the COMSOL blog this spring for specific blog posts about the Acoustic Diffusion Equation and Ray Acoustics physics interfaces.
In the meantime, here is a list of suggested reading material:
- H. Kuttruff, Room Acoustics, CRC Press, Fifth Edition, 2009.
- A. D. Pierce, Acoustics, An Introduction to its Physical Principles and Applications, Acoustical Society of America, 1991.
- ISO 3382 Standard, Measurement of room acoustic parameters.
- M. R. Schroeder, New Method of Measuring Reverberation Time, J. Acoust. Soc. Am., 37 (1965).
- M. R. Schroeder, Integrated-Impulse method measuring sound decay without using impulses, J. Acoust. Soc. Am., 66 (1979).

Comments (2)
Tom Walker
November 21, 2020Hi there,
I am planning on trying to learn how to use COMSOL Multiphysics for analysing the acoustic properties of a small study booth product I am designing for a University project. I plan on designing a U-shape desk divider “booth” made from acoustic foam, that will shield the user from 3 sides, but will not enclose them – giving an effect similar to studying at a Carrell desk.
I am interested in two things. 1). The amount of shielding from noise from the rest of the room the user will get, and 2). the acoustic properties inside the “booth”, in order to design it so that it improves the audio heard by others when video conferencing. (i.e. decreasing reverberation picked up by the user’s laptop microphone.
Do you think the learning and using the COMSOL acoustic module could help me obtain this information? It seems like an incredible program, but at present I do not have any experience of using it! I would really appreciate it if you could drop me a line via email to discuss this further if possible.
All the best,
Tom Walker
tomwalker902@gmail.com
Mads Herring Jensen
December 16, 2020 COMSOL EmployeeHi Tom
Yes, this is definitely something you can use COMSOL to model. For the low to mid frequency range you can use the full wave formulation in the frequency domain. This will let you model the porous material and shielding in detail. For higher frequencies, you can then switch to ray tracing. I suggest you contact your local COMSOL office for more information. Maybe you can also join one of our workshops to get introduced to the program.
Best regards
Mads