- Bridging the Terahertz Gap
- Modeling the Lithium-Ion Battery
- Protection contre la Corrosion
- Modélisation des batteries
- Modélisation et Simulation dans le développement des piles à combustible
- Modélisation thermique des petits satellites
- Analyse électro-vibroacoustique d'un transducteur à armature équilibrée
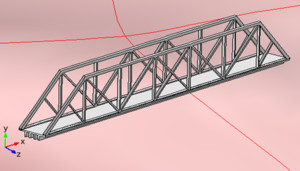
Vibration and Acoustic Analysis of a Trussed Railroad Bridge under Moving Loads
Two finite element models have been developed to investigate the acoustic radiation from a Pratt truss train bridge. The first model was a time dependent structural model that determined the vibration response of the structure due to two wheels, representing a single axle, moving across the bridge at constant speed. This model was expanded to include multiple axles to represent a locomotive. The second model was an acoustic model of the bridge. The structural model was used to calculate the particle accelerations at points along the structure, which were later applied as boundary conditions in the acoustic model. Schematics of the bridge used in the structural and acoustic models are shown in Figure 1. Use of COMSOL Multiphysics: Accelerations of points in the structural model were processed to determine the magnitude and phase within a narrow frequency band and within a specified time window. This process resulted in an acceleration profile, an example of which is shown in Figure 2. These plots represent the magnitude and phase of the vertical acceleration of the four stringers within the 8.5 Hz frequency bin and during a 0.5 sec interval shortly after the wheels of the locomotive entered the bridge. Acceleration profiles were also constructed for the lateral motion of the stringers and for other beams that comprise the truss. The acoustic model consisted of a collection of extruded 3-dimensional shapes representing the beams that make up the bridge, including a solid deck. The bridge was placed above a surface representing the local topography and within a hemisphere of air (not shown in Figure). The acceleration profiles were input to the acoustic model as interpolation file, which served as acceleration boundary conditions in the frequency-response acoustic model. The acoustic model can predict the sound pressure levels (SPL) and the acoustic energy radiated by the bridge. The SPL contours corresponding to the acceleration profile of Figure 2 are plotted in Figure 3. The plots show that the area of highest SPL is located directly under the bridge, in agreement with conclusions from [Imaichi, 1982]. The radiated sound power was determined by integrating the intensity over the surface of the hemisphere. This was done for consecutive time intervals as the locomotive traversed the bridge. The result is shown in Figure 4. The second curve in this figure plots the SPL at a point 90 m directly above the center of the bridge, or 100 m above the ground. The locomotive has four axles and the plot shows how the radiated power changes as more axles enter the bridge. It was possible to compare the radiated power from different frequency bins and for different time intervals. The most sound was radiated from the 8.5 Hz bin during the time interval shortly after the axle entered the bridge. Comparisons were made for different speeds and axle weights. In addition, it was possible to disable different parts of the vibrating structure to determine which parts of the structure radiated the most sound.
Téléchargement
- costley_presentation.pdf - 2.49MB
- costley_abstract.pdf - 0.49MB