Centre d'apprentissage
Débuter avec COMSOL Multiphysics®
Résultats / Contours et isovaleurs
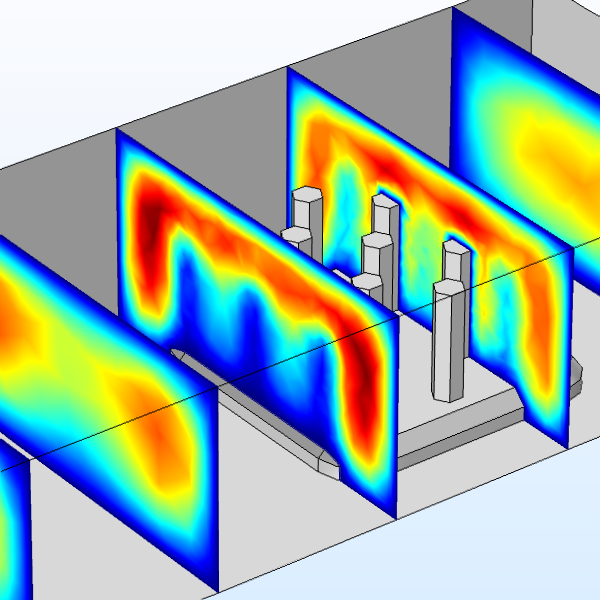
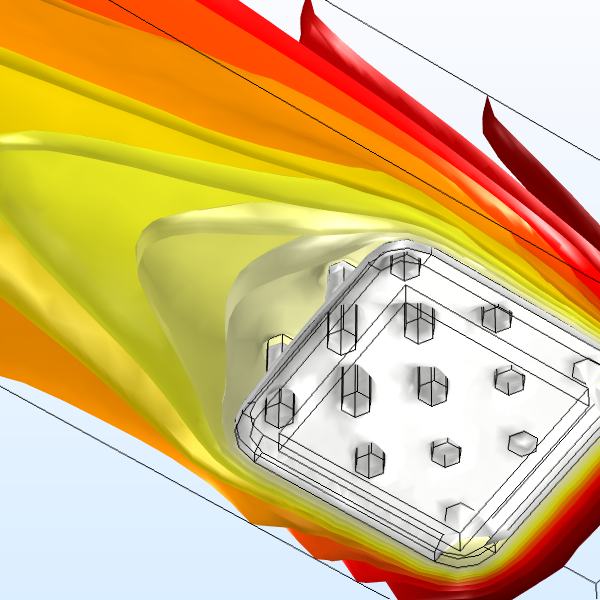
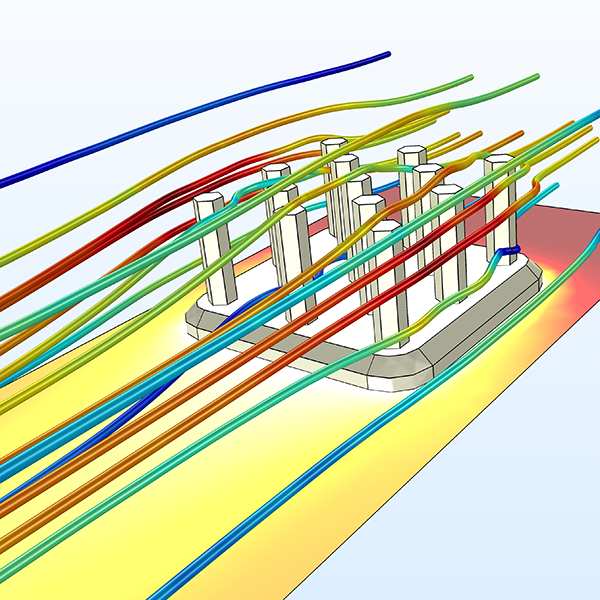
Show results using colored lines or surfaces. Duration: 7:11Contour and Isosurface plots are used in postprocessing to visualize scalar quantities and fields in your simulation results. Contour plots display your results on a series of colored regions or lines. Isosurface plots display your results on a set of colored surfaces where the results quantity is constant.
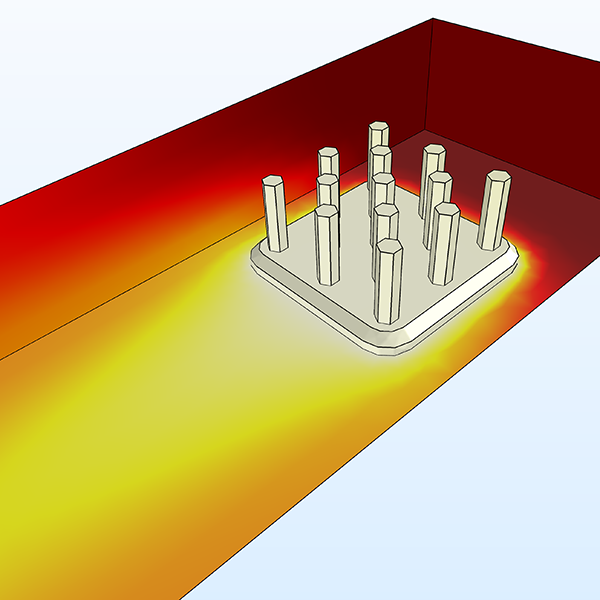
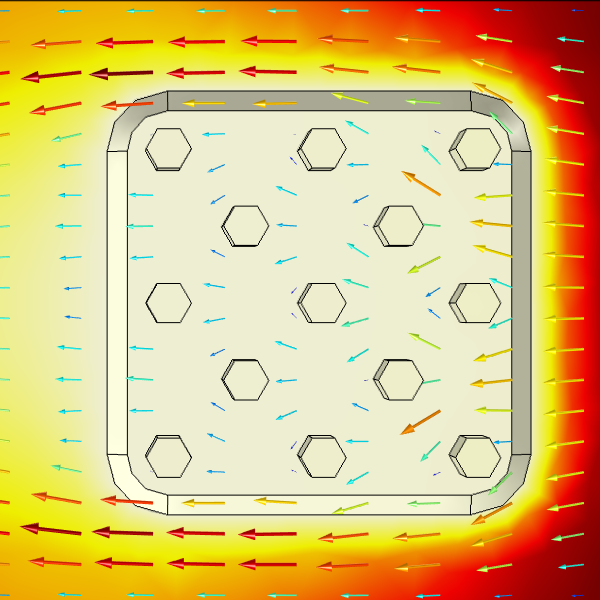
Watch this video to learn how to use these plot types to fit the needs of your COMSOL Multiphysics® model. For the heat sink model shown here, we can add contours or isosurfaces to show the temperature changing with distance from the heat sink.
Playlist Vidéo
Résultats
Vidéos: 7
-
Introduction
-
Interface Utilisateur
-
Géometrie
-
Définitions
-
Matériaux
-
Physiques
-
Maillage
-
études
-
Résultats
-
Constructeur d'applications

