Centre d'apprentissage
Débuter avec COMSOL Multiphysics®
Résultats / Graphiques de coupes
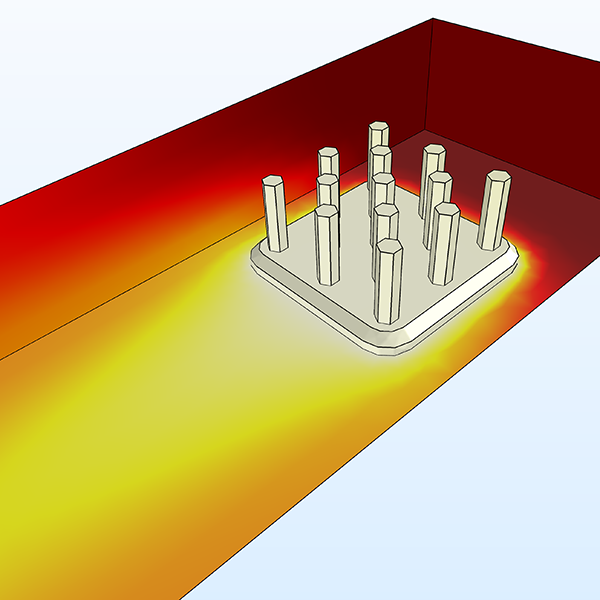
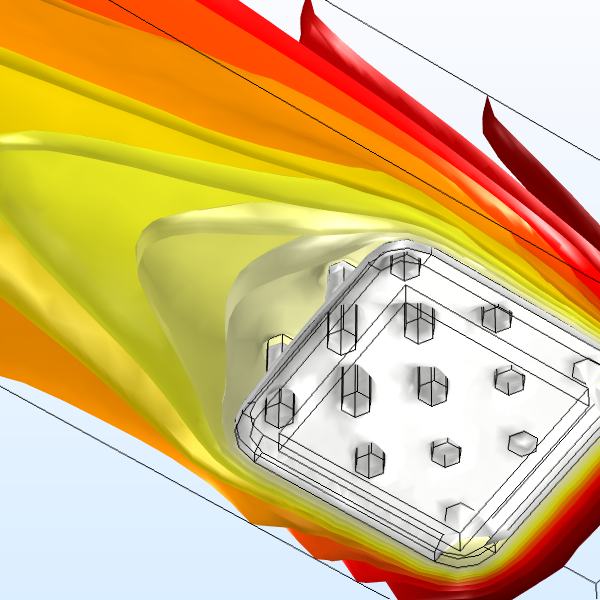
Display results in cross sections. Duration: 6:31Slice plots are a postprocessing tool that can be applied to your COMSOL Multiphysics® simulations that are modeled in 3D. You can use a Slice plot to display a quantity on one or more cross-sectional areas within your 3D domain, usually to visualize the change in a variable throughout the domain.
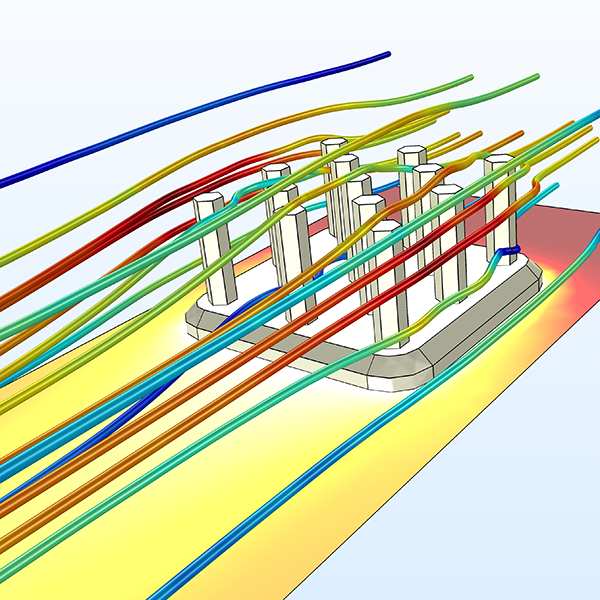
Watch the video to learn how to use Slice plots to fit the needs of your model. For the heat sink model we demonstrate here, we can add a Slice plot to show the temperature changing with distance from the heat sink, or the velocity of the air changing as it flows through the channel.
Playlist Vidéo
Résultats
Vidéos: 7
-
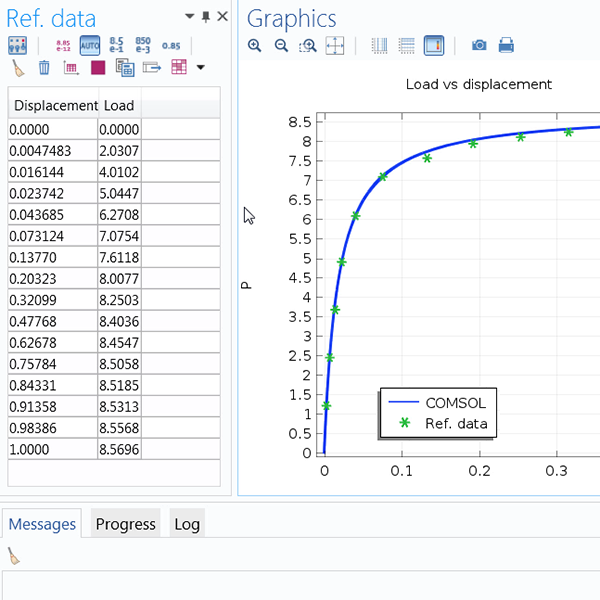
Importer des données de référence
Import external data to compare with results.
-
Graphiques de surface, de volume, et sur lignes
Show results on different geometric entity levels.
-
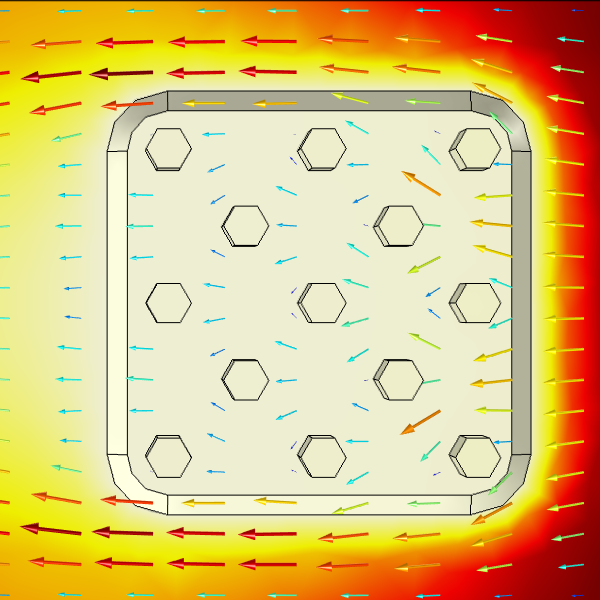
Graphiques de flèches
Visualize field distributions in your results.
-
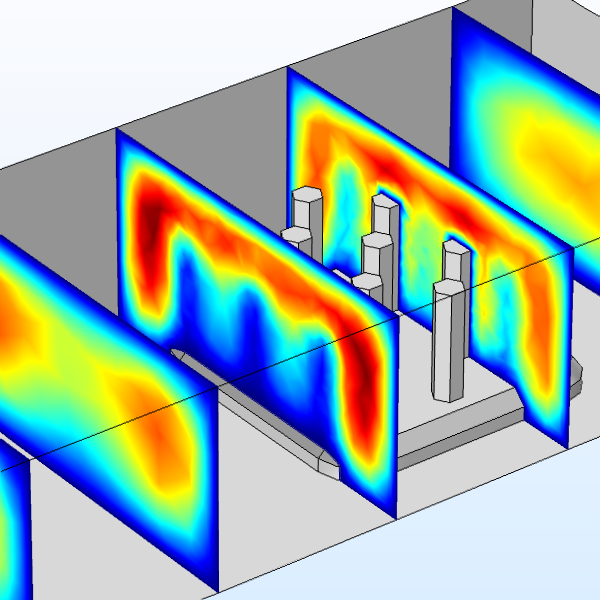
Graphiques de coupes
Display results in cross sections.
-
Contours et isovaleurs
Show results using colored lines or surfaces.
-
Graphiques en lignes de courant
Visualize vector quantities in your results.
-
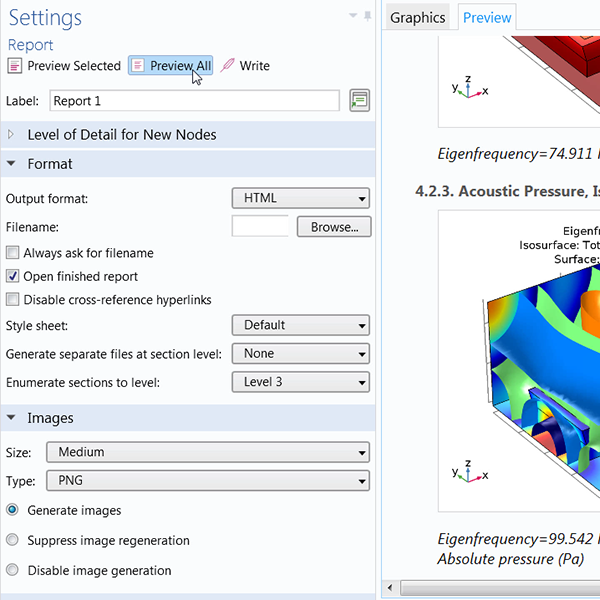
Génération de rapports
Export reports of your model from the software.
-
Introduction
-
Interface Utilisateur
-
Géometrie
-
Définitions
-
Matériaux
-
Physiques
-
Maillage
-
études
-
Résultats
-
Constructeur d'applications