Centre d'apprentissage
Débuter avec COMSOL Multiphysics®
Résultats / Contours et isovaleurs
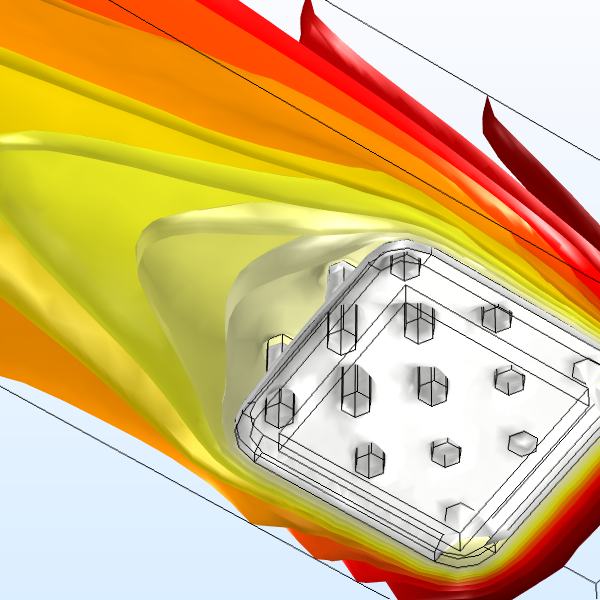
Show results using colored lines or surfaces. Duration: 7:11Contour and Isosurface plots are used in postprocessing to visualize scalar quantities and fields in your simulation results. Contour plots display your results on a series of colored regions or lines. Isosurface plots display your results on a set of colored surfaces where the results quantity is constant.
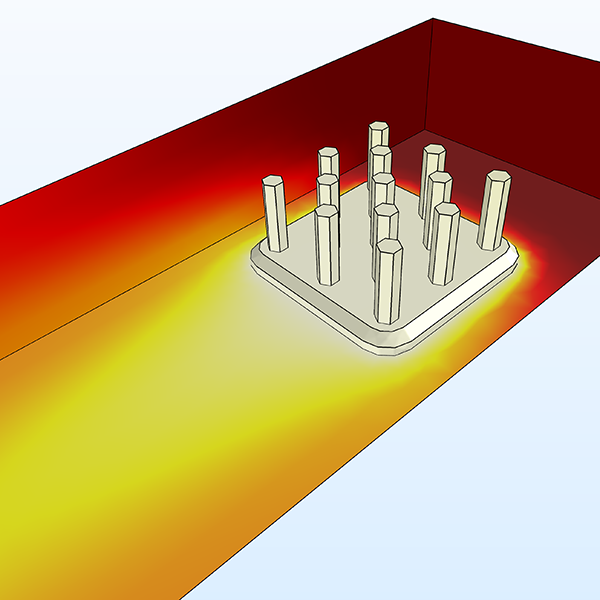
Watch this video to learn how to use these plot types to fit the needs of your COMSOL Multiphysics® model. For the heat sink model shown here, we can add contours or isosurfaces to show the temperature changing with distance from the heat sink.
Fichiers de l'exercice
Playlist Vidéo
Résultats
Vidéos: 7
-
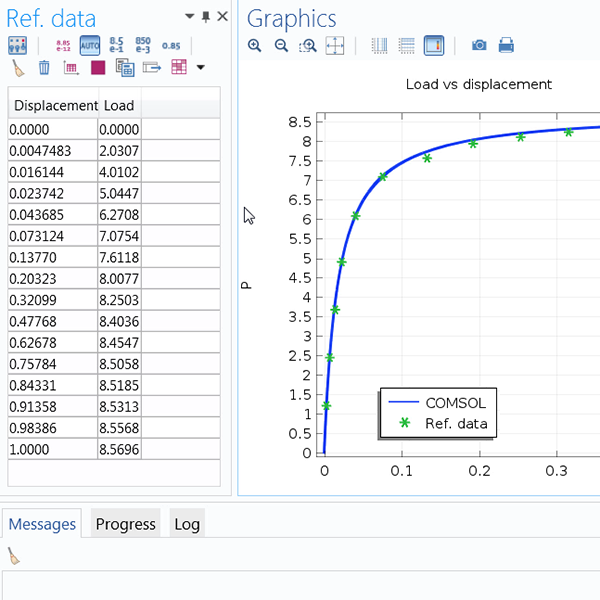
Importer des données de référence
Import external data to compare with results.
-
Graphiques de surface, de volume, et sur lignes
Show results on different geometric entity levels.
-
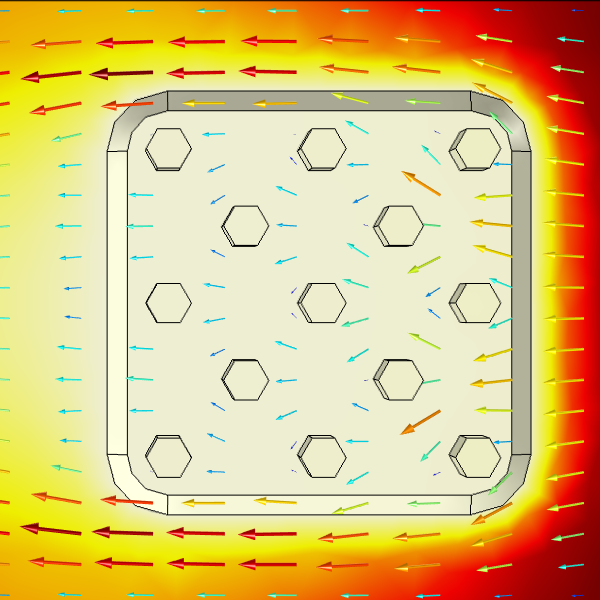
Graphiques de flèches
Visualize field distributions in your results.
-
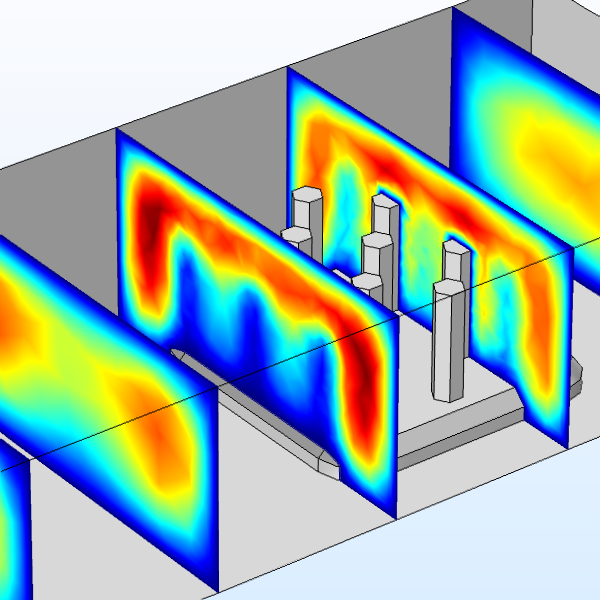
Graphiques de coupes
Display results in cross sections.
-
Contours et isovaleurs
Show results using colored lines or surfaces.
-
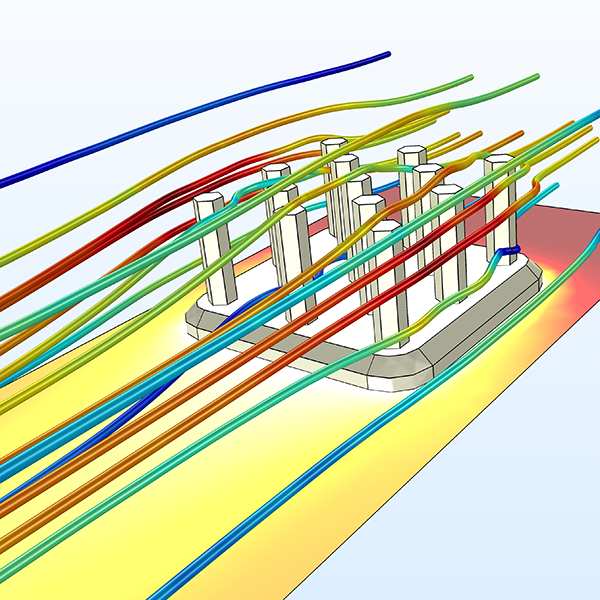
Graphiques en lignes de courant
Visualize vector quantities in your results.
-
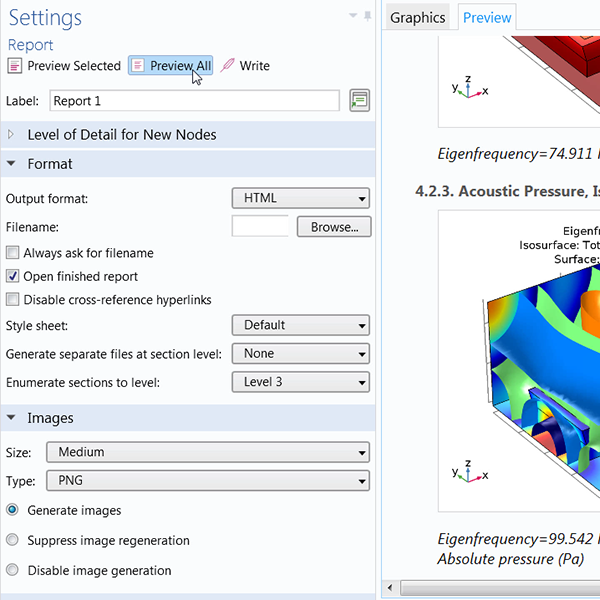
Génération de rapports
Export reports of your model from the software.
-
Introduction
-
Interface Utilisateur
-
Géometrie
-
Définitions
-
Matériaux
-
Physiques
-
Maillage
-
études
-
Résultats
-
Constructeur d'applications