Centre d'apprentissage
Débuter avec COMSOL Multiphysics®
Résultats / Graphiques de surface, de volume, et sur lignes
Show results on different geometric entity levels. Duration: 8:06The COMSOL Multiphysics® software contains many tools for postprocessing and visualizing your simulation results. Among the many plot types available are Surface, Line, and Volume plots.
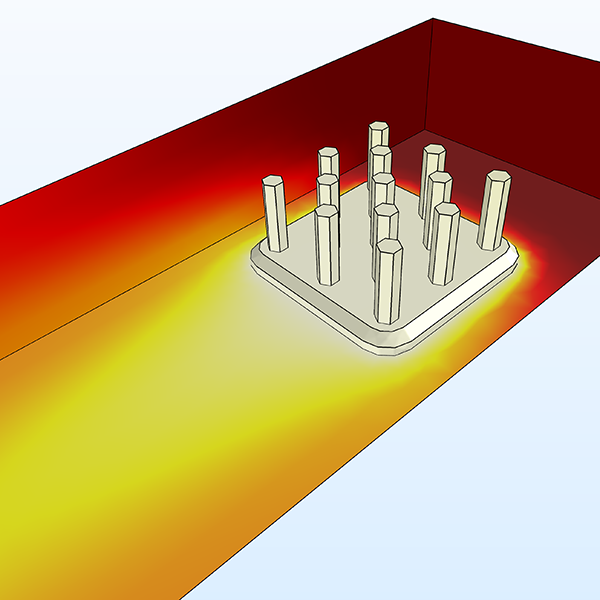
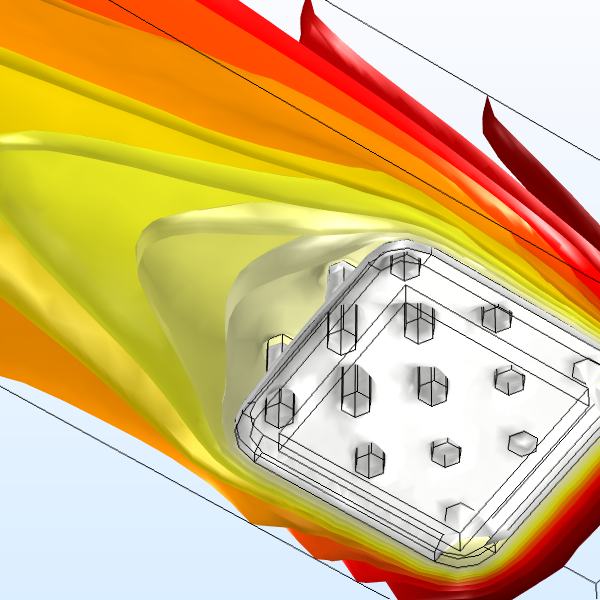
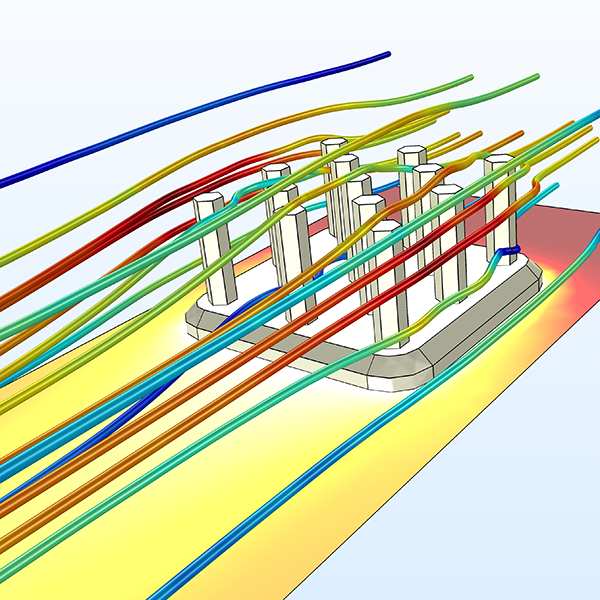
Surface plots are used to display results quantities on surfaces, such as the boundaries of 3D domains. 3D Line plots are used to display results quantities on lines, such as the edges of a boundary. Volume plots are used to display quantities on 3D domains.
Watch this video to see how to create these three plot types and learn about the various plot options, such as hiding geometric entities and manipulating color and data ranges. This demonstration uses a model of a heat sink, as there are multiple physics phenomena involved, including fluid flow and heat transfer.
Fichiers de l'exercice
Playlist Vidéo
Résultats
Vidéos: 7
-
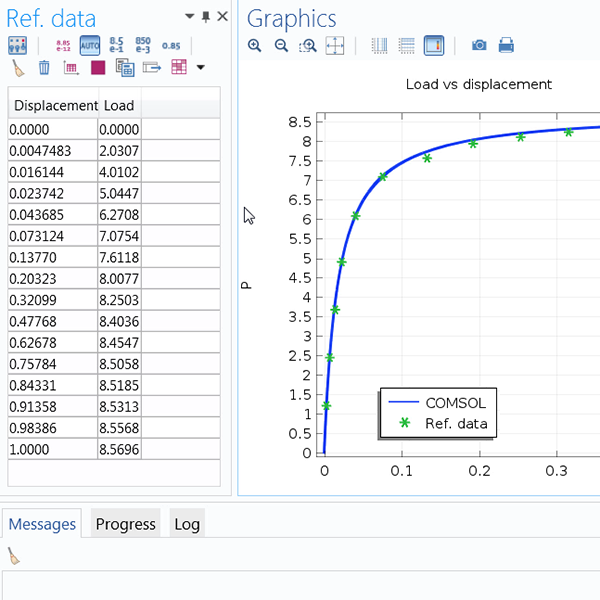
Importer des données de référence
Import external data to compare with results.
-
Graphiques de surface, de volume, et sur lignes
Show results on different geometric entity levels.
-
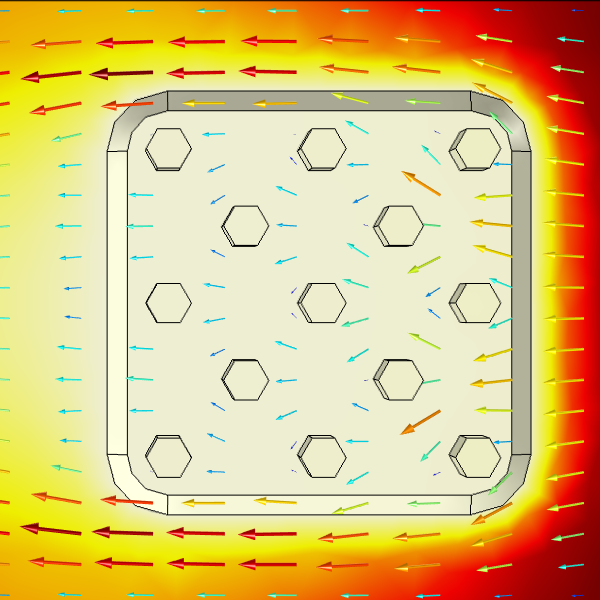
Graphiques de flèches
Visualize field distributions in your results.
-
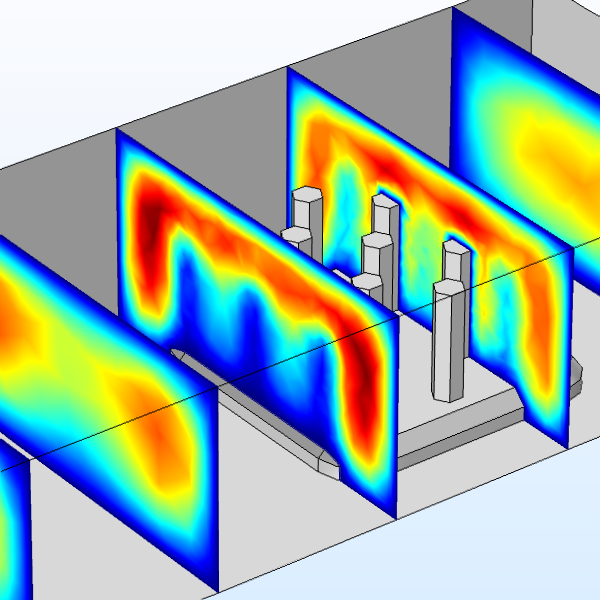
Graphiques de coupes
Display results in cross sections.
-
Contours et isovaleurs
Show results using colored lines or surfaces.
-
Graphiques en lignes de courant
Visualize vector quantities in your results.
-
Génération de rapports
Export reports of your model from the software.
-
Introduction
-
Interface Utilisateur
-
Géometrie
-
Définitions
-
Matériaux
-
Physiques
-
Maillage
-
études
-
Résultats
-
Constructeur d'applications